


Software Development KPIs: Essential Metrics for 2026
Software development KPIs are supposed to create clarity yet many teams end up with the opposite: dozens of dashboards, inconsistent definitions, and weekly reporting that doesn’t change any decisions. If you’re leading engineering, product, or delivery, the goal in 2026 isn’t “track more. It’s to track a small set of software development KPIs that connect day-to-day execution (PRs, deployments, incidents) to outcomes leadership actually cares about (reliability, speed to market, customer impact, and team sustainability).
In this guide, we’ll break down the KPIs that consistently show up in high-performing teams, how they map to proven measurement frameworks like DORA and SPACE, and how to roll them out without creating a culture of metric-gaming. You’ll also get a practical “starter set” of KPIs you can implement in 1–2 sprints, plus tool recommendations to automate collection across Jira, GitHub/GitLab, CI/CD, and incident management.
What Are Software Development KPIs? (and how they differ from metrics)
A KPI (Key Performance Indicator) is a metric you choose because it’s tightly tied to a goal—like faster delivery, fewer incidents, or higher adoption. A “metric” is any measurable signal (number of PRs, number of bugs, story points, test count). Not every metric deserves KPI status.
A simple rule that helps:
- Metrics tell you what happened (or is happening).
- KPIs tell you whether you’re winning on outcomes that matter.
In practice, software teams often mix these up. For example, “tickets closed” is a metric; “cycle time trending down while change failure rate stays stable” is closer to a KPI because it reflects speed with quality.
In agile development metrics, it’s also useful to separate:
- Leading indicators (signals you can influence quickly): WIP, review time, build time, cycle time.
- Lagging indicators (outcomes that show later): uptime, customer satisfaction, churn, revenue impact.
If you want a refresher on agile concepts that impact measurement, see our guide on what agile software development is.
Tip: Pick KPIs you can influence
If a team can’t change the KPI in the next one or two sprints through process or tooling improvements, it’s probably too lagging or too high-level to be useful for day-to-day execution.
Why Software Development KPIs Matter (real benefits not vanity reporting)
Used correctly, KPIs aren’t “exec theater.” They’re a feedback system for improving delivery.
- Ship faster with fewer surprises: KPIs like cycle time and lead time make delays visible early.
- Protect quality while scaling: change failure rate and escaped defects prevent “speed-only” optimization.
- Reduce incident cost: MTTR and incident trends help you invest in reliability where it pays off.
- Improve predictability: stakeholders stop guessing when delivery becomes measurable and repeatable.
- Keep teams healthy: developer productivity metrics can surface overload and review bottlenecks—without surveillance.
If a KPI doesn’t drive a decision, it’s probably just noise.
KPI frameworks to know in 2026: DORA vs SPACE vs DevEx
Most high-quality KPI programs borrow from at least one of these frameworks:
- DORA metrics focus on delivery performance and operational stability (core DevOps outcomes). Google Cloud hosts DORA research and reports here: https://cloud.google.com/devops/state-of-devops
- SPACE is a research-backed framework for developer productivity measurement that avoids “single-number productivity.” (See the SPACE paper: https://arxiv.org/abs/2102.01552)
- DevEx (Developer Experience) programs often combine workflow friction, platform reliability, and enablement signals.
Here’s the practical difference:
| Framework | Best for | What it measures well | Where teams misuse it |
|---|---|---|---|
| DORA | Delivery + ops outcomes | Speed + stability (balanced) | Treating it as a leaderboard |
| SPACE | Developer productivity | Multi-dimensional productivity | Tracking individuals instead of systems |
| DevEx | Sustainable engineering | Friction, enablement, satisfaction | Measuring sentiment without acting |
Recommendation: Use DORA for delivery, add 1–2 SPACE dimensions for team health, and connect to business outcomes (adoption, support load, NPS) so leadership sees impact.
Essential software development KPIs (by category) + how to use each one
The fastest way to make KPIs useful is to group them into categories. That keeps you from optimizing one number at the expense of everything else.
Delivery & flow KPIs (speed and throughput)
-
- Cycle time
How long it takes work to go from “started” to “done” (often: in-progress → merged → deployed). Why it matters: it’s one of the clearest indicators of delivery friction.
- Cycle time
-
- Lead time for changes (DORA)
Time from code committed (or PR opened) to running in production. Use it to detect slow review/QA/release stages.
- Lead time for changes (DORA)
-
- Deployment frequency (DORA)
How often you deploy to production. Healthy pattern: frequent, small releases—especially for customer-facing products.
- Deployment frequency (DORA)
-
- Work in progress (WIP)
How many items are active at once. Too much WIP increases context switching and delays finishing.
- Work in progress (WIP)
-
- Flow efficiency
Percent of time a work item is actively being worked on vs waiting. Use it to pinpoint queues (waiting for review, QA, or approval).
- Flow efficiency
Quality & reliability KPIs (stability and resilience)
-
- Change failure rate (DORA)
% of deployments that cause incidents, rollbacks, or hotfixes. Guardrail: if deployment frequency rises but CFR rises too, you’re shipping risk.
- Change failure rate (DORA)
-
- MTTR — mean time to recovery/restore (DORA)
How quickly you recover from incidents. Use it to justify investments in observability, runbooks, and on-call health.
- MTTR — mean time to recovery/restore (DORA)
-
- Escaped defects / customer-reported issues
Bugs found after release. Closer to user impact than internal bug counts.
- Escaped defects / customer-reported issues
-
- Bug rate + time to resolution
How many bugs are created vs resolved and how quickly they’re addressed. Best practice: segment by severity (P0/P1/P2), not a single blended number.
- Bug rate + time to resolution
Planning & predictability KPIs (delivery confidence)
-
- Sprint predictability (commitment vs completion)
Are you delivering what you planned? Don’t punish teams for misses—use it to improve planning quality.
- Sprint predictability (commitment vs completion)
-
- Burndown / burnup (trend, not a score)
Useful for visualizing progress and scope changes. Watch out: burndown is easy to misread when scope shifts mid-sprint.
- Burndown / burnup (trend, not a score)
Team health & developer productivity metrics (use carefully)
This is where many teams go wrong by measuring individuals. The goal is to detect systemic friction.
-
- PR review time / pickup time
How long code waits for review. Fix review policies, ownership, and reviewer load balancing.
- PR review time / pickup time
-
- Context switching rate (proxy)
How often engineers bounce between tasks/repos. Reduce interruptions, meetings, and thrash.
- Context switching rate (proxy)
-
- Developer satisfaction / DevEx pulse
A lightweight monthly pulse (e.g., 3–5 questions) can reveal burnout and tooling pain—if leadership commits to acting on it.
- Developer satisfaction / DevEx pulse
Business impact KPIs (tie engineering to outcomes)
-
- Feature adoption rate
Do shipped features get used? This closes the loop between “delivered” and “valuable.”
- Feature adoption rate
-
- NPS / CSAT (product-level)
Not owned solely by engineering, but engineering influences it through performance, reliability, and UX.
- NPS / CSAT (product-level)
If you want a shorter list-style set of KPI examples, you can also reference our post on the best KPIs for software development.
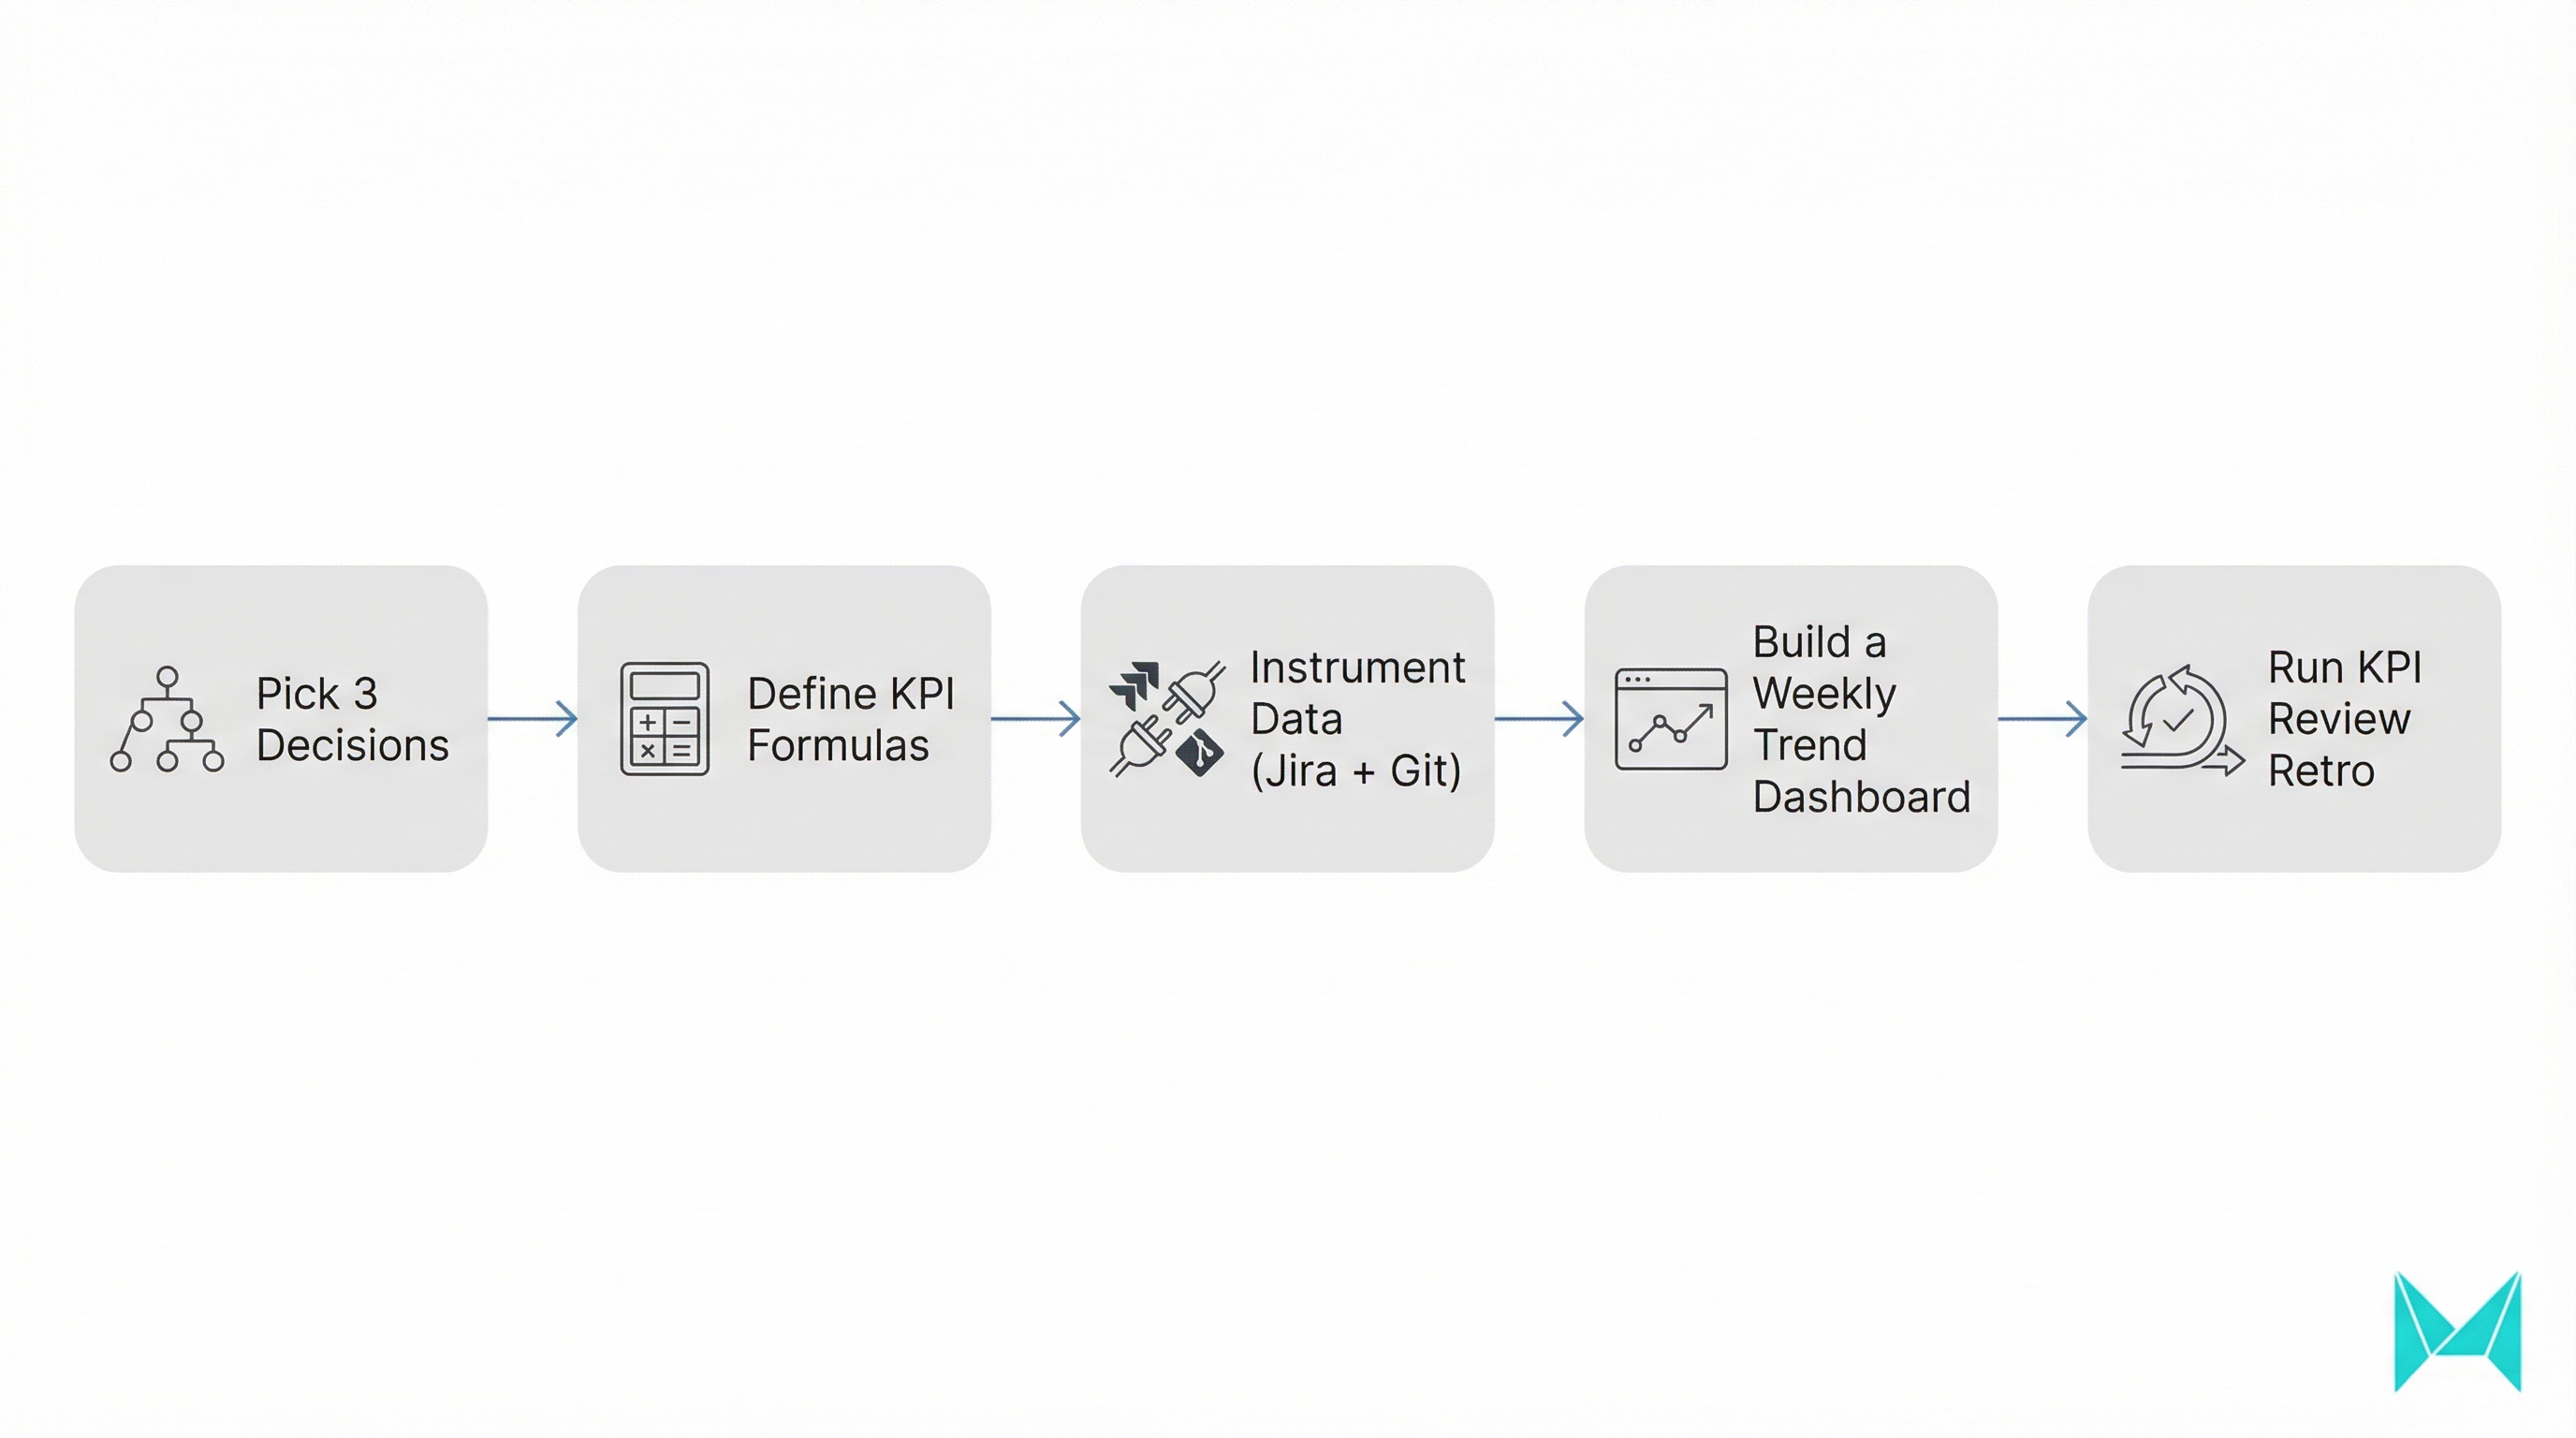
A practical KPI starter set by role
- DORA set: lead time, deployment frequency, change failure rate, MTTR
- Reliability: uptime/SLO attainment, incident volume (trend)
- Business: feature adoption (top features), support load (tickets per active user)
- Health: quarterly DevEx pulse (3–5 questions) with action tracking
Rollout tip
Start with no more than 6–8 KPIs per role. Review weekly as trends, not scorecards. Add or drop KPIs based on the decisions you actually made from them.
Best practices (and common mistakes) when rolling out software development KPIs
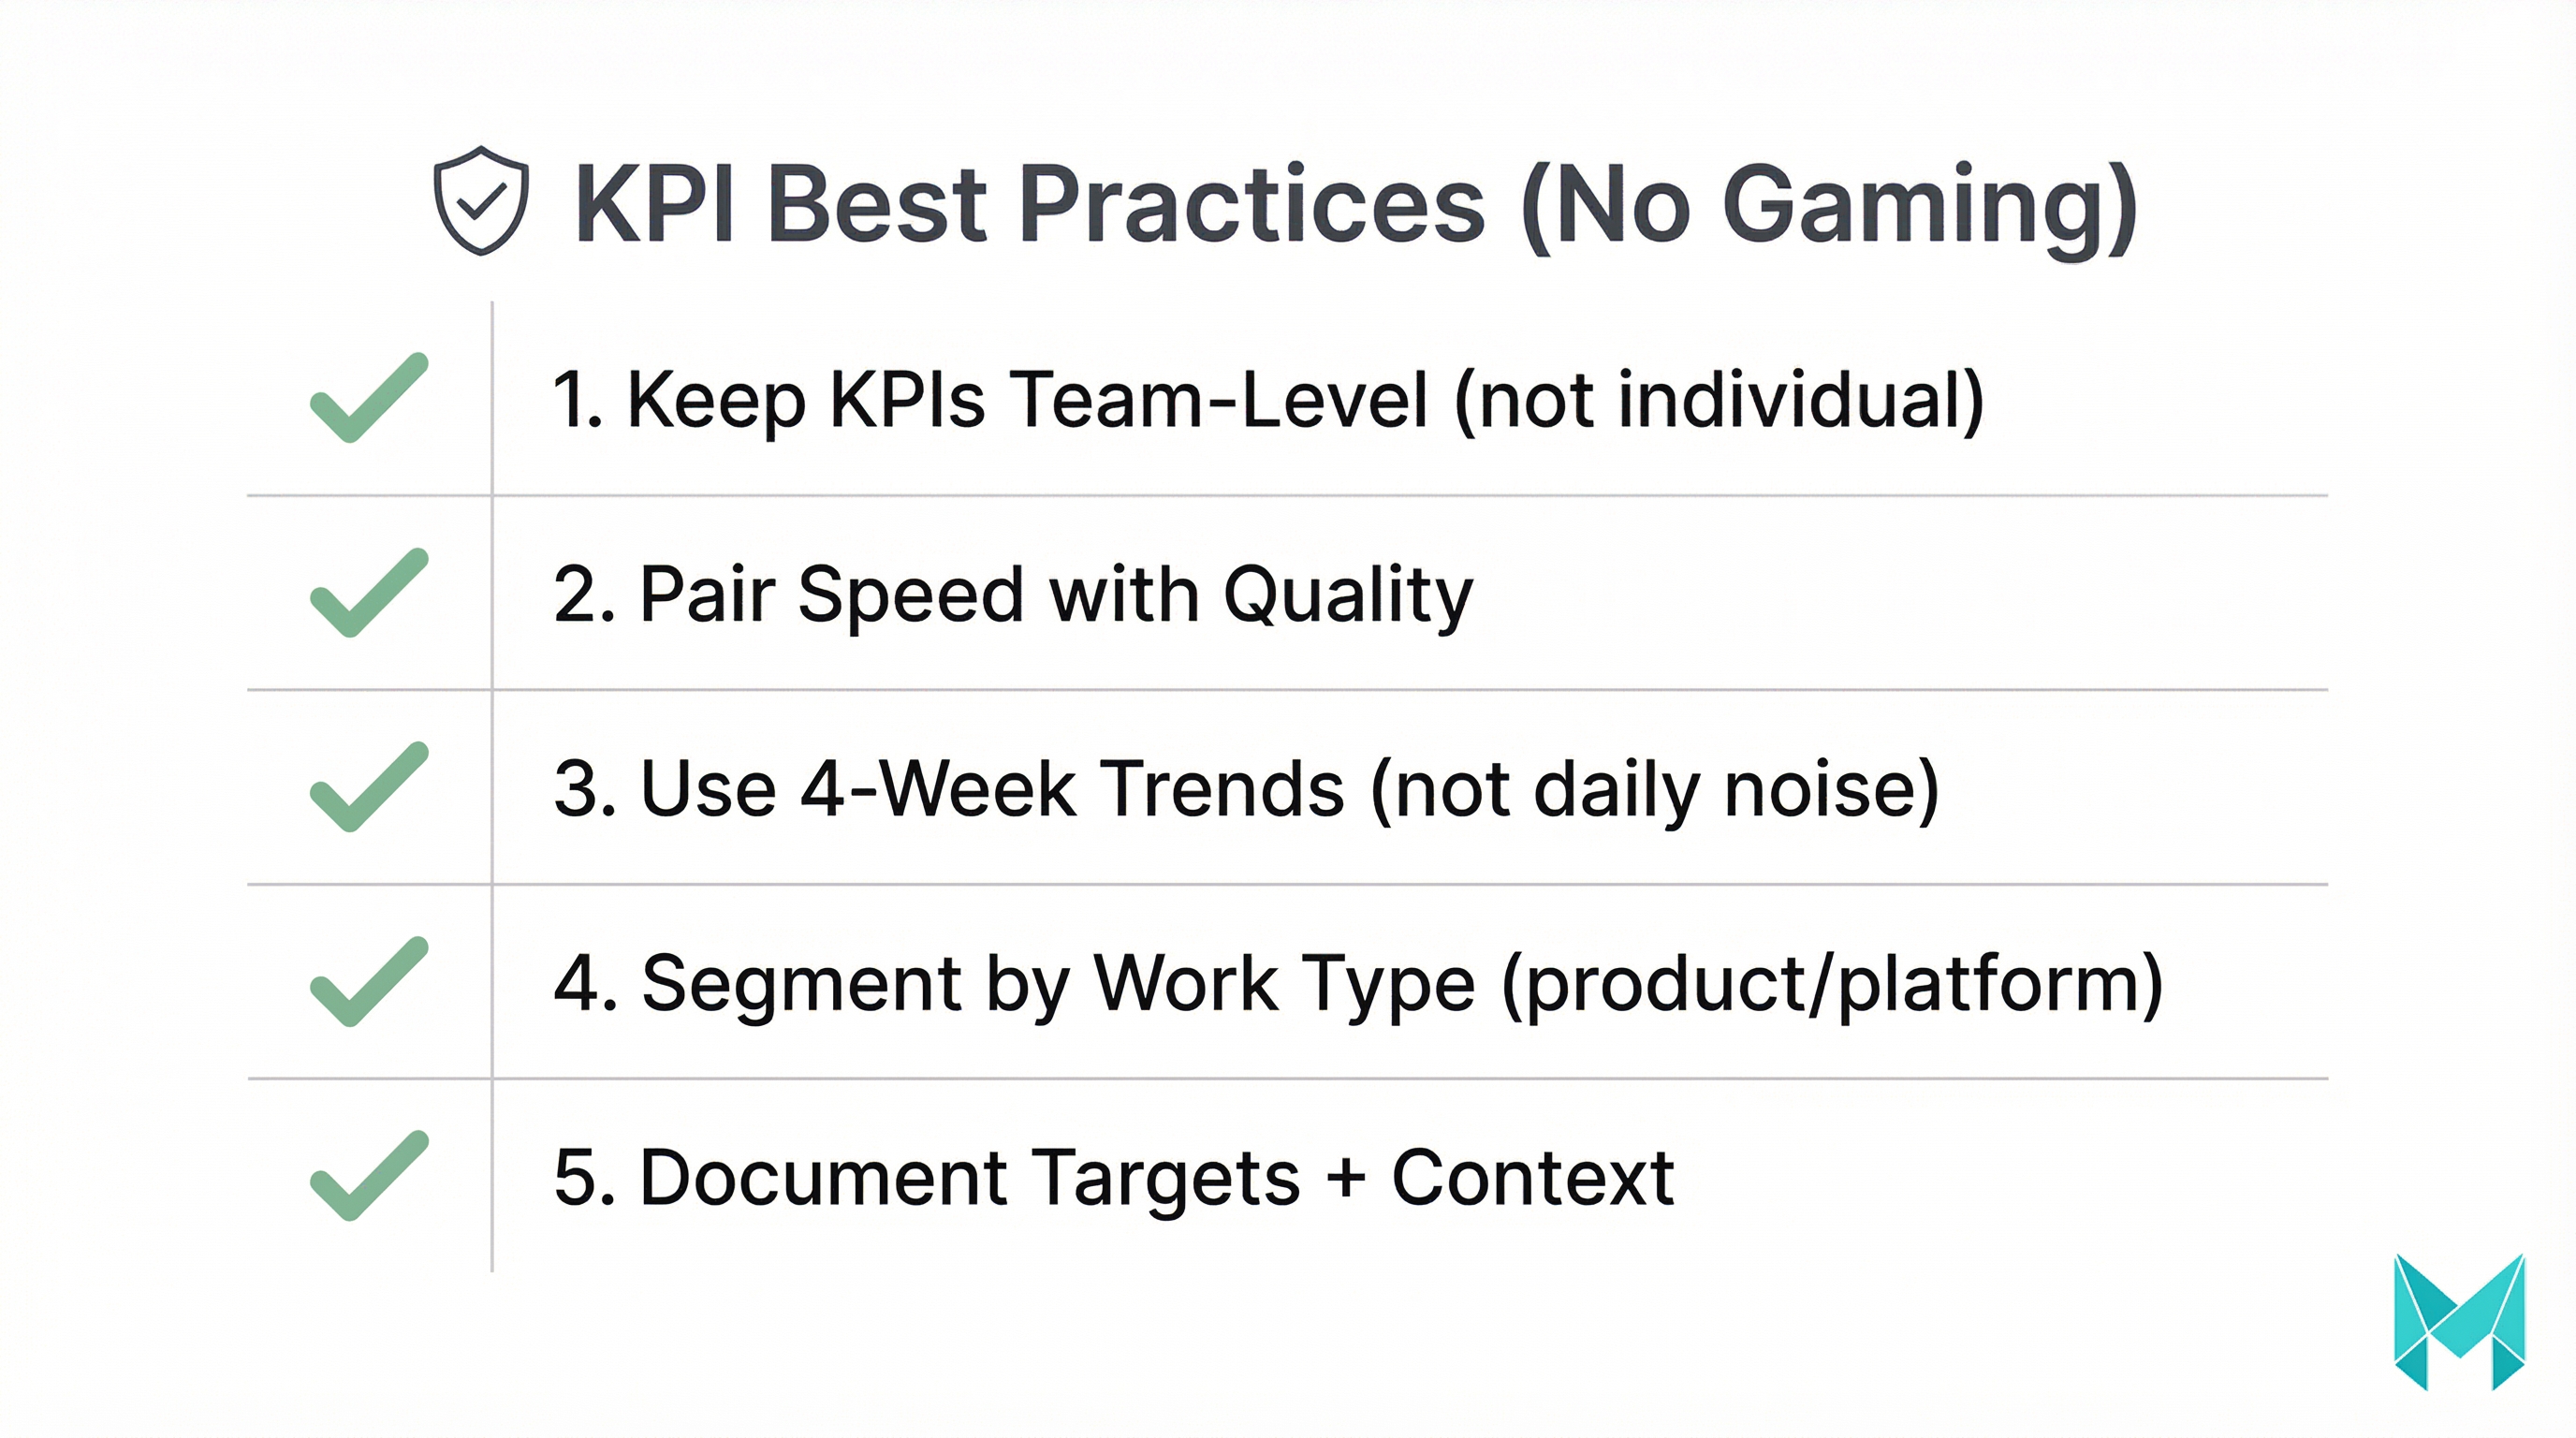
Best practices
- Start from decisions, not data: “What decision will this KPI inform in the next 30 days?”
- Define each KPI in one sentence: scope, formula, and what “good” looks like.
- Pair speed with quality: always track a delivery KPI + a stability KPI together.
- Use trends, not snapshots: weekly or sprint-level trends > daily noise.
- Segment metrics by team type: platform, product, and data teams need different targets.
Common mistakes to avoid
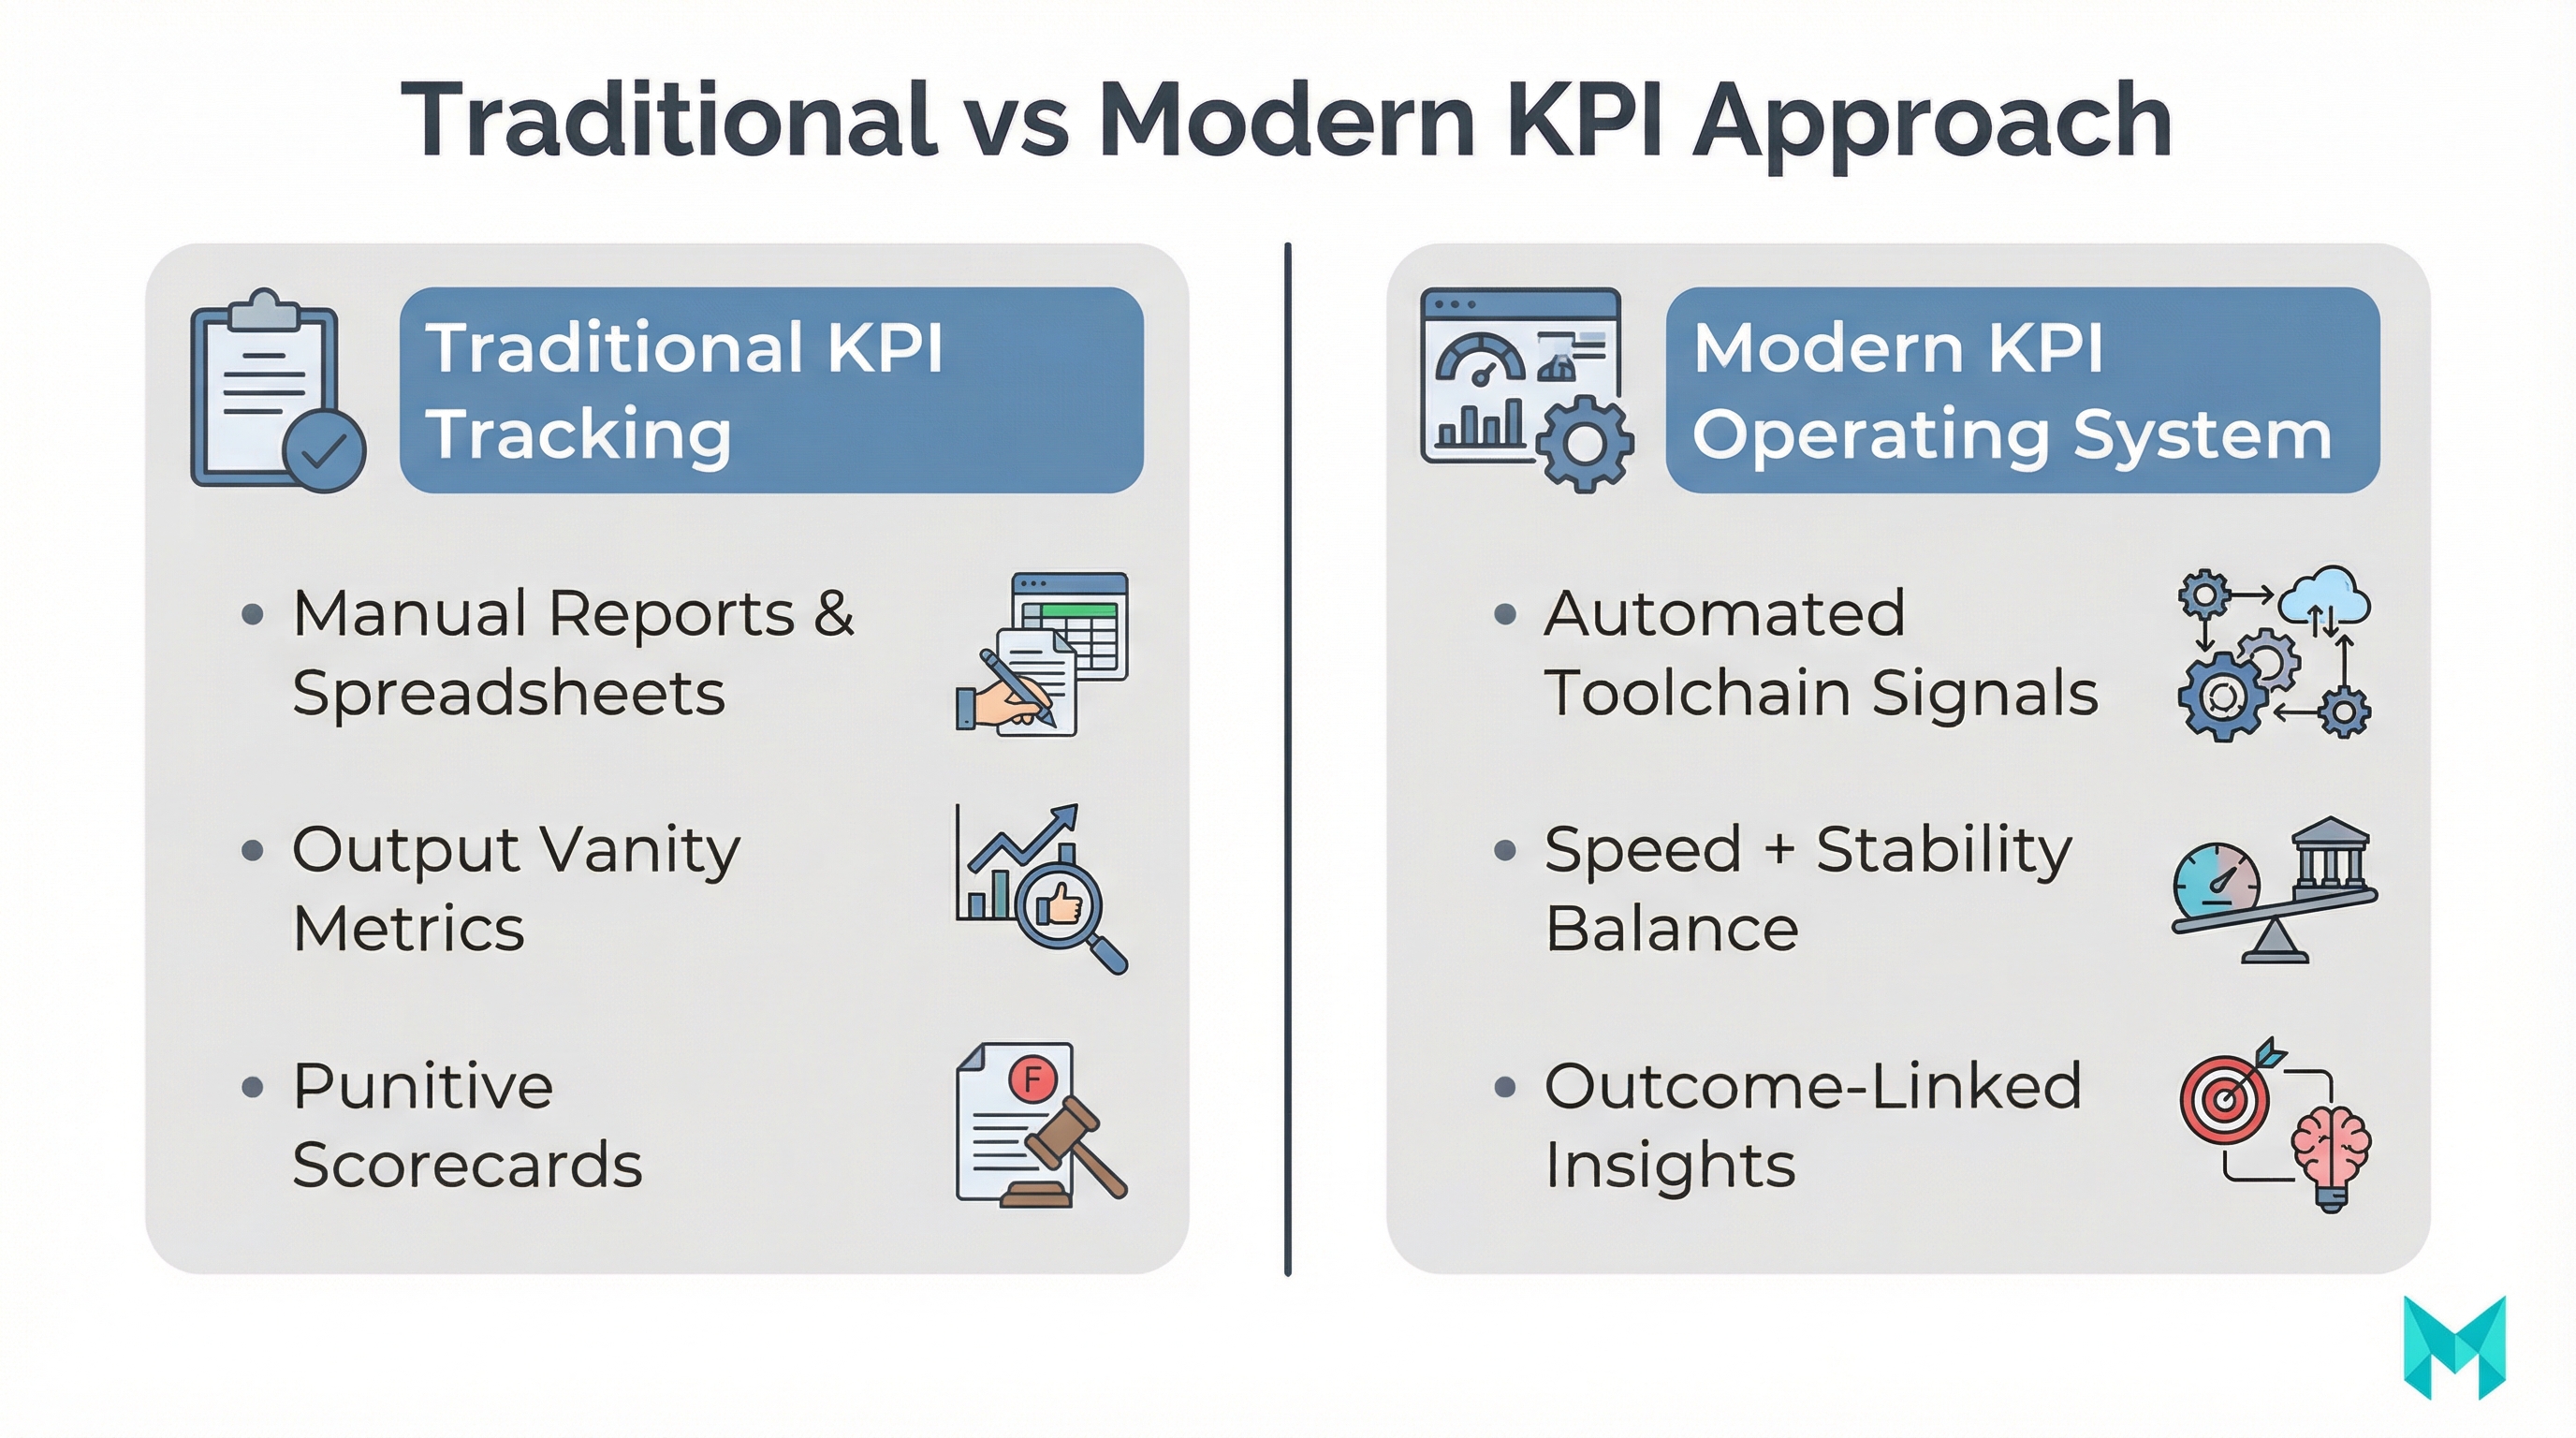
Avoid these KPI pitfalls
- Vanity KPIs: lines of code, raw commit count, story points used to rank teams.
- Manual reporting: spreadsheet KPIs rarely survive beyond a quarter.
- Punitive use: people will game the system, and the data becomes useless.
- Stopping at “merged”: ignoring post-deploy signals hides customer impact.
Tools and platforms to track KPIs (software metrics tools)
You can calculate many KPIs from tools you already use— if you automate collection:
- Jira / Linear: cycle time by workflow state, WIP, throughput
- GitHub / GitLab: PR pickup time, review time, merge frequency
- CI/CD (GitHub Actions, GitLab CI, CircleCI): build time, deployment frequency
- Observability (Datadog, Grafana, New Relic): incident frequency, time to detect
- Incident management (PagerDuty, Opsgenie): MTTR, on-call load
Common KPI platforms that show up in the SERP ecosystem include Jellyfish, Appfire Flow, LinearB, Cortex, DX, and Datapad. The key is choosing a stack that reduces manual effort and keeps definitions consistent.
Frequently Asked Questions (FAQs)
Software development KPI metrics are the small set of measures you use to evaluate whether engineering is achieving outcomes like faster delivery, higher quality, and reliable operations. They typically include DORA metrics (lead time, deployment frequency, change failure rate, MTTR) plus a few context-specific KPIs for quality and business impact.
How Musketeers Tech Can Help
If you want software development KPIs that actually improve delivery (instead of becoming another reporting burden), Musketeers Tech can help you design and implement a KPI system end-to-end—starting from your business goals and working backward to measurable signals across your toolchain.
We typically support teams by:
- Defining a minimum viable KPI set (DORA + quality + business impact) with clear formulas and governance
- Building automated KPI dashboards by integrating Jira/Linear, Git providers, CI/CD, and incident tools
- Setting up a KPI rollout process (cadence, owners, “anti-gaming” guardrails, and retrospective loops)
This approach is especially useful when you’re scaling an MVP into a product organization or standardizing delivery across multiple squads—areas we often support through our strategy and delivery work.
Get Started Learn More View PortfolioLearn more about our Software Strategy Consulting or see how we helped clients with similar challenges in our portfolio.
Final Thoughts
The best software development KPIs in 2026 are the ones that make decisions easier: they highlight bottlenecks, reduce delivery risk, protect team health, and connect engineering work to customer outcomes. If you’re starting fresh, begin with DORA metrics for delivery performance, add one or two team-health signals from SPACE/DevEx, and tie it all to a business outcome like adoption or support load.
Most importantly: don’t treat KPIs as a scoreboard. Treat them as a feedback loop. When you define metrics clearly, automate collection, and review trends consistently in retros and planning, your KPIs become a practical operating system for continuous improvement— not dashboard clutter.
Need help with software development KPIs? Check out our consulting services or explore our recent projects.
Last updated: 05 Feb, 2026