Portfolio
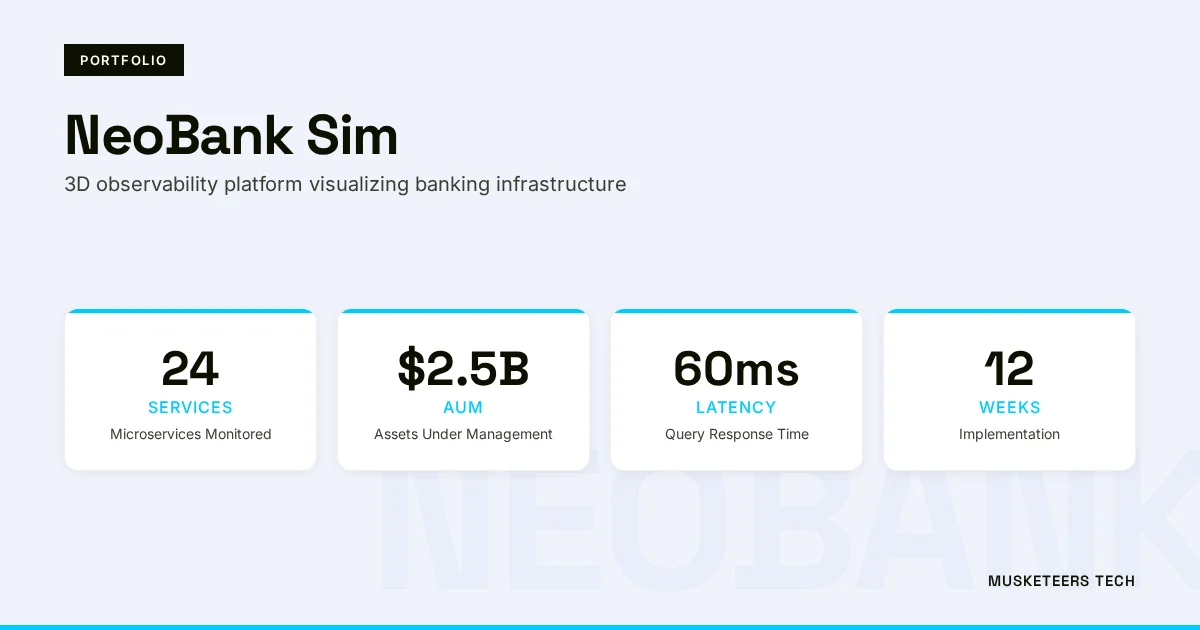
NeoBank Sim: 3D Infrastructure Monitoring & Microservices Visualization
- Category:
Digital Transformation, Software Development, Product & Engineering
- Software:
Unity, Compute Shaders, WebGL, WebSocket, Node.js
- Service:
Metaverse & VR Development
- Client:
NeoBank Corp
- Date:
December 6, 2025
NeoBank Sim is a revolutionary infrastructure monitoring platform that transforms abstract server logs and metrics into a navigable 3D digital city, making system health instantly readable through spatial visual metaphors. Built on Unity by Musketeers Tech, the platform visualizes thousands of containerized microservices as buildings — where height represents server load, color indicates error rate, and visual “power lines” reveal service dependencies. DevOps teams fly through the digital city to spot critical errors instantly, while VR “War Room” mode enables collaborative incident response with holographic infrastructure manipulation. NeoBank Corp achieved a 50% reduction in Mean Time To Resolution (MTTR) for system outages and maintains 99.99% uptime through proactive visual monitoring.
Infrastructure as a City
Complex distributed systems are impossible to comprehend through text logs and line charts alone. NeoBank Sim transforms abstract infrastructure monitoring into intuitive spatial metaphors — a “blocked road” is a service outage, a “speeding car” is a high-frequency transaction, and a “fire” is a critical error cascade — making system health instantly readable by any team member, not just senior engineers.
Challenge & Solution
The Challenge: NeoBank Corp’s cloud-native architecture involves thousands of containerized microservices scaling dynamically in response to transaction load. Traditional infrastructure monitoring through text logs, line charts, and 2D dashboards was becoming unmanageable — DevOps teams struggled to identify the root cause of latency chains across hundreds of interdependent services amid the noise of millions of requests per second. The multi-dimensional relationships between services, databases, message queues, and external APIs created cascading failure patterns that flat monitoring tools could not effectively visualize. NeoBank Corp needed a microservices visualization platform that could make system topology and health intuitively comprehensible, enable rapid root-cause identification during incidents, and provide a shared visual context for cross-team incident response.
The Solution: Musketeers Tech engineered NeoBank Sim as a 3D system observability platform deployed to both WebGL browsers and VR headsets. The WebGL “Digital City” renders each microservice as a building in a persistent 3D cityscape — building height represents current server load, building color shifts from green through amber to red based on error rate, and animated connection lines between buildings visualize dependency chains and request flow. DevOps teams navigate the city in real-time, spotting “fires” (critical errors) and “traffic jams” (latency bottlenecks) through spatial patterns rather than scrolling through log streams. The VR “War Room” mode activates during major incidents, enabling multiple engineers to stand around a holographic infrastructure map and manipulate traffic routing with hand gestures — effectively rerouting payment flows around crashed server clusters in real time. The security visualization layer renders cyberattacks as distinct particle effects, making DDoS attacks appear as meteor showers and injection attempts as tunneling agents, helping non-security staff understand threat severity. This digital transformation of system observability replaced scroll-heavy dashboards with spatial intelligence that surfaces infrastructure problems at the speed of perception.
Spatial System Observability
In the WebGL browser view, NeoBank Corp’s entire microservices architecture appears as a living digital city. Each service is a building whose dimensions, color, and activity communicate real-time health metrics. DevOps teams fly through the cityscape to identify infrastructure problems through spatial recognition — congestion patterns, isolated failures, and cascading dependency chains are visible as physical formations rather than buried in log text.
Monitoring Capabilities:
- Building height representing real-time server load with dynamic scaling as capacity changes
- Color-coded error rate indication shifting from green through amber to red as thresholds are breached
- Animated dependency lines showing request flow between services with latency-based thickness
- 360-degree navigation enabling system-wide visibility from any perspective or zoom level
- Historical playback mode replaying infrastructure state over time for post-incident analysis
Final Result
NeoBank Sim has transformed infrastructure monitoring at NeoBank Corp from a reactive text-scanning exercise into an intuitive spatial experience. The platform validated that 3D microservices visualization delivers measurably faster incident response and proactive system health management compared to traditional 2D monitoring dashboards.
50% Faster Triage
Mean Time To Resolution (MTTR) for system outages dropped by 50% through intuitive 3D visualization of error cascades and dependency chain failures.
99.99% Uptime
Proactive spatial monitoring via the Digital City enabled the team to detect and mitigate load spikes and emerging failures before they caused user-facing downtime.
Unified Operations
The WebGL dashboard bridged the communication gap between engineering and management, providing a shared visual language for system health across all organizational levels.
NeoBank Sim demonstrates that infrastructure monitoring becomes exponentially more effective when system topology is perceived spatially rather than textually — transforming incident response from searching logs into seeing patterns.